Clusters
Enroll machines as your team's compute and storage, watch their health, and manage their roles, queues and data.
A cluster is a machine enrolled in your team that runs the VOLT cluster daemon. The VOLT server coordinates the work; clusters do it. A cluster:
- runs jobs: analysis pipelines, trajectory previews, GLB preprocessing, artifact uploads and plugin preparation;
- stores your team's data: trajectory files, analysis results and plugin binaries live on the cluster that owns them;
- runs the Jupyter containers of notebooks on a server.
The daemon connects out to the server over a WebSocket, so the machine needs outbound access to the server but no inbound port opened to it. A team can have several clusters, in different places, each with its own role.
A team needs at least one connected cluster to work. While no cluster of the selected team is Connected, every dashboard page sends you to cluster setup (/onboarding/cluster/setup) until one connects.
In the browser runtime and the desktop app, the machine is the tab or window itself: the server and a cluster daemon run inside it and enroll on their own. These runtimes do not offer the pages on this guide. The sidebar has no Clusters section, the right-click menu has no Connect new cluster, and /onboarding/cluster/setup, /dashboard/clusters and /dashboard/clusters/:clusterId send you back to /dashboard.
Who can manage clusters
Cluster pages and operations use the team's team permission. With the built-in roles, an Owner can do everything below and a Member can view clusters and their metrics. Admin and Viewer have no team permission, so the server refuses them cluster requests. See Teams for the full catalog.
| Operation | Permission |
|---|---|
| List clusters, open the monitoring page | team:read |
| Add a cluster, show its install command, queue a transfer, delete it | team:create |
| Change the role or the queue concurrency | team:update |
Enroll a machine
Name the cluster
Open cluster setup. During onboarding you land there after creating your team. Afterwards, use Add new Cluster on the Clusters page, Add New Cluster when the list is empty, or Connect new cluster in the right-click menu.
Under Let's name your cluster, enter a Cluster name (for example, Research Lab Cluster) and click Continue. Clusters you already created are listed below the form under Your clusters, with their status, a Connect button for those still waiting, and a delete button.
Copy the install command
The Copy & Paste on your cluster host dialog shows the install command. Pick the host's operating system (Windows, Linux or macOS; the dialog preselects yours) and copy the command.
The command carries the cluster's id and a one-time enrollment token. The token is consumed when the installer first reaches the server, so a command works for one installation.
Run it on the machine
Run the command in a terminal on the machine that will be the cluster. On Linux and macOS it needs curl and root or sudo access.
The dialog follows the cluster's status as the installer progresses. When the daemon connects, the page shows <name> connected! and takes you to your workspace. If nothing connects within 90 seconds, it shows Still waiting for your cluster: check that the daemon is running and that outbound WebSocket connections are allowed, then click Still waiting / Retry.
The commands look like this (<cluster-id>, <enrollment-token> and the server address are filled in for you):
curl -sSL https://raw.githubusercontent.com/voltlabs-research/VOLT/main/packages/infra/cluster/scripts/install.sh \
  | VOLT_CLOUD_URL="https://volt.example.edu" bash -s -- "<cluster-id>" "<enrollment-token>"
powershell -NoProfile -ExecutionPolicy Bypass -Command "$scriptPath = Join-Path $env:TEMP 'volt-cluster-install.ps1'; Invoke-WebRequest -UseBasicParsing 'https://raw.githubusercontent.com/voltlabs-research/VOLT/main/packages/infra/cluster/scripts/install.ps1' -OutFile $scriptPath; & $scriptPath -TeamClusterId '<cluster-id>' -EnrollmentToken '<enrollment-token>' -VoltCloudUrl 'https://volt.example.edu'"A self-hosted server can also enroll its own machine as the first cluster while you set it up; see Self-hosting.
What the installer does
- Checks the platform. Linux and macOS hosts must be
x86_64/amd64oraarch64/arm64; Windows hosts use the PowerShell installer. - Makes sure Docker and Docker Compose are installed and running:
- Linux: if they are missing, installs Docker Engine and the Compose plugin from Docker's repositories (Debian and Ubuntu with
apt, Fedora and RHEL-like systems withdnforyum) and enables the service withsystemctl. - macOS: installs Docker Desktop with Homebrew, or from Docker's download when Homebrew is absent, and launches it. This needs an interactive desktop session.
- Windows: installs Docker Desktop with
winget, or with Docker's installer, asking for elevation, and launches it.
- Linux: if they are missing, installs Docker Engine and the Compose plugin from Docker's repositories (Debian and Ubuntu with
- On Linux and macOS, makes sure
python3is available, installing it on macOS if needed. - On Linux, creates a
voltuser that owns the installation and can use Docker. - Sends the enrollment token to the server. The cluster becomes Healthcheck received and the installer receives the daemon's credentials.
- Downloads the install manifest from the server and writes it to
<install root>/<cluster-id>. - On Linux and macOS, pulls the Jupyter image that notebooks run in (
ghcr.io/voltlabs-research/volt-jupyter-scripting:main). - Starts a Docker Compose project with two services: PostgreSQL 17 for the daemon's own tables, and the cluster daemon (
ghcr.io/voltlabs-research/volt-cluster-daemon:main), which gets the host's Docker socket so it can start notebook containers. - Waits up to 90 seconds for the daemon to report that it started, then prints the install root.
| Host | Default install root |
|---|---|
| Linux | /opt/volt/team-clusters |
| macOS | ~/Library/Application Support/Volt/team-clusters |
| Windows | %LOCALAPPDATA%\Volt\team-clusters |
Set TEAM_CLUSTER_INSTALL_ROOT (or pass -InstallRoot to the PowerShell script) to install somewhere else. The cluster daemon architecture page describes what runs inside the daemon.
The Clusters page
Open Clusters › View all in the sidebar (/dashboard/clusters). Under Clusters, the sidebar also lists each cluster with a Monitor link. The table updates live as clusters change state.
| Column | Shows |
|---|---|
| Cluster | The cluster's name. |
| Lifecycle | Its enrollment and connection status (see below). |
| Role | Its role, with a summary or, while it converges to a new role, what is draining and the role in effect. |
| Metrics | The health of its live metrics (see below). |
| CPU, Memory | Current use, as five bars that turn amber from 60% and red from 80%. |
| Disk | Space available in GB, with the same bars for the share in use. |
| Last Heartbeat | When the daemon last reported. |
Click a row to open its monitoring page. Each row's menu has Monitor, Show install command, Edit queue concurrency, Change runtime role, Transfer storage + listing state and Delete cluster.
Lifecycle statuses
| Status | Meaning |
|---|---|
| Waiting for connection | Created; no installer has used its enrollment token yet. |
| Healthcheck received | The installer reached the server with a valid token and is setting the machine up. |
| Connected | The daemon is connected and heartbeating. Only connected clusters receive work. |
| Disconnected | The daemon was connected and its connection dropped. It returns to Connected when it reconnects. |
| Deleting | You deleted it while it was connected; VOLT is waiting for the daemon to uninstall. |
| Delete failed | The daemon neither confirmed the uninstall nor disconnected within two minutes. |
Metrics status
| Status | Meaning |
|---|---|
| Active | Healthy. |
| Warning | CPU or memory at 75% or more, or disk at 85% or more. |
| Critical | CPU, memory or disk at 90% or more. |
| Pending | The page is receiving live metrics, but this cluster has not reported any yet. It may be starting or offline. |
| Paused | The page cannot reach the live metrics stream right now. |
The monitoring page
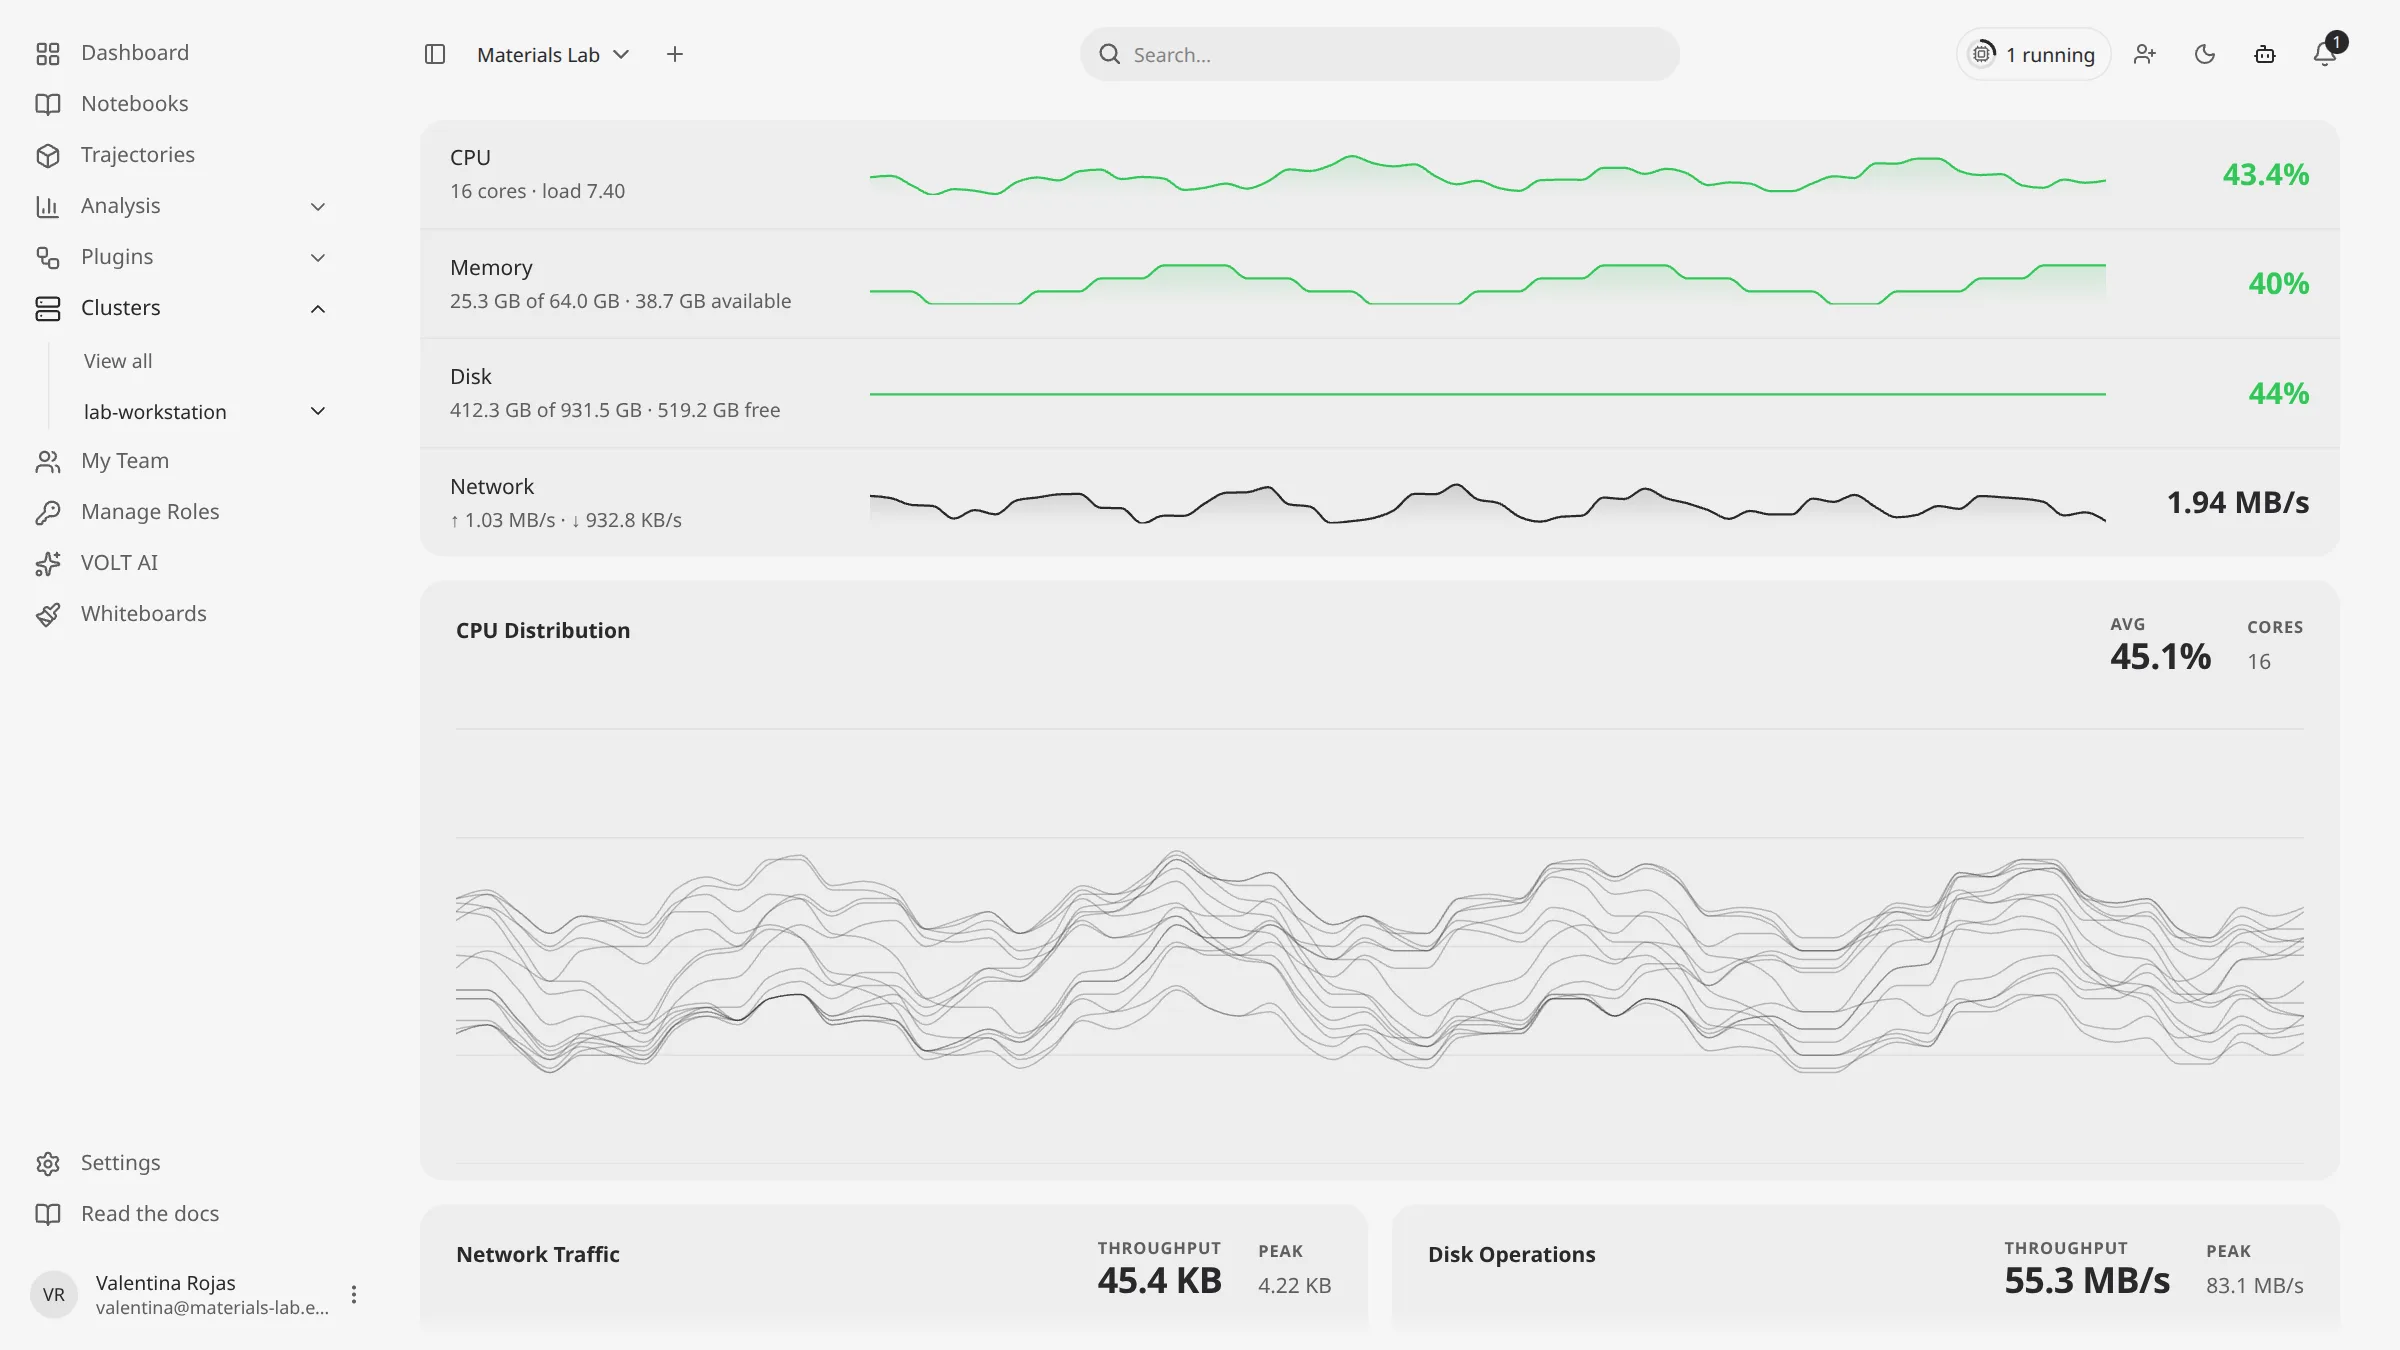
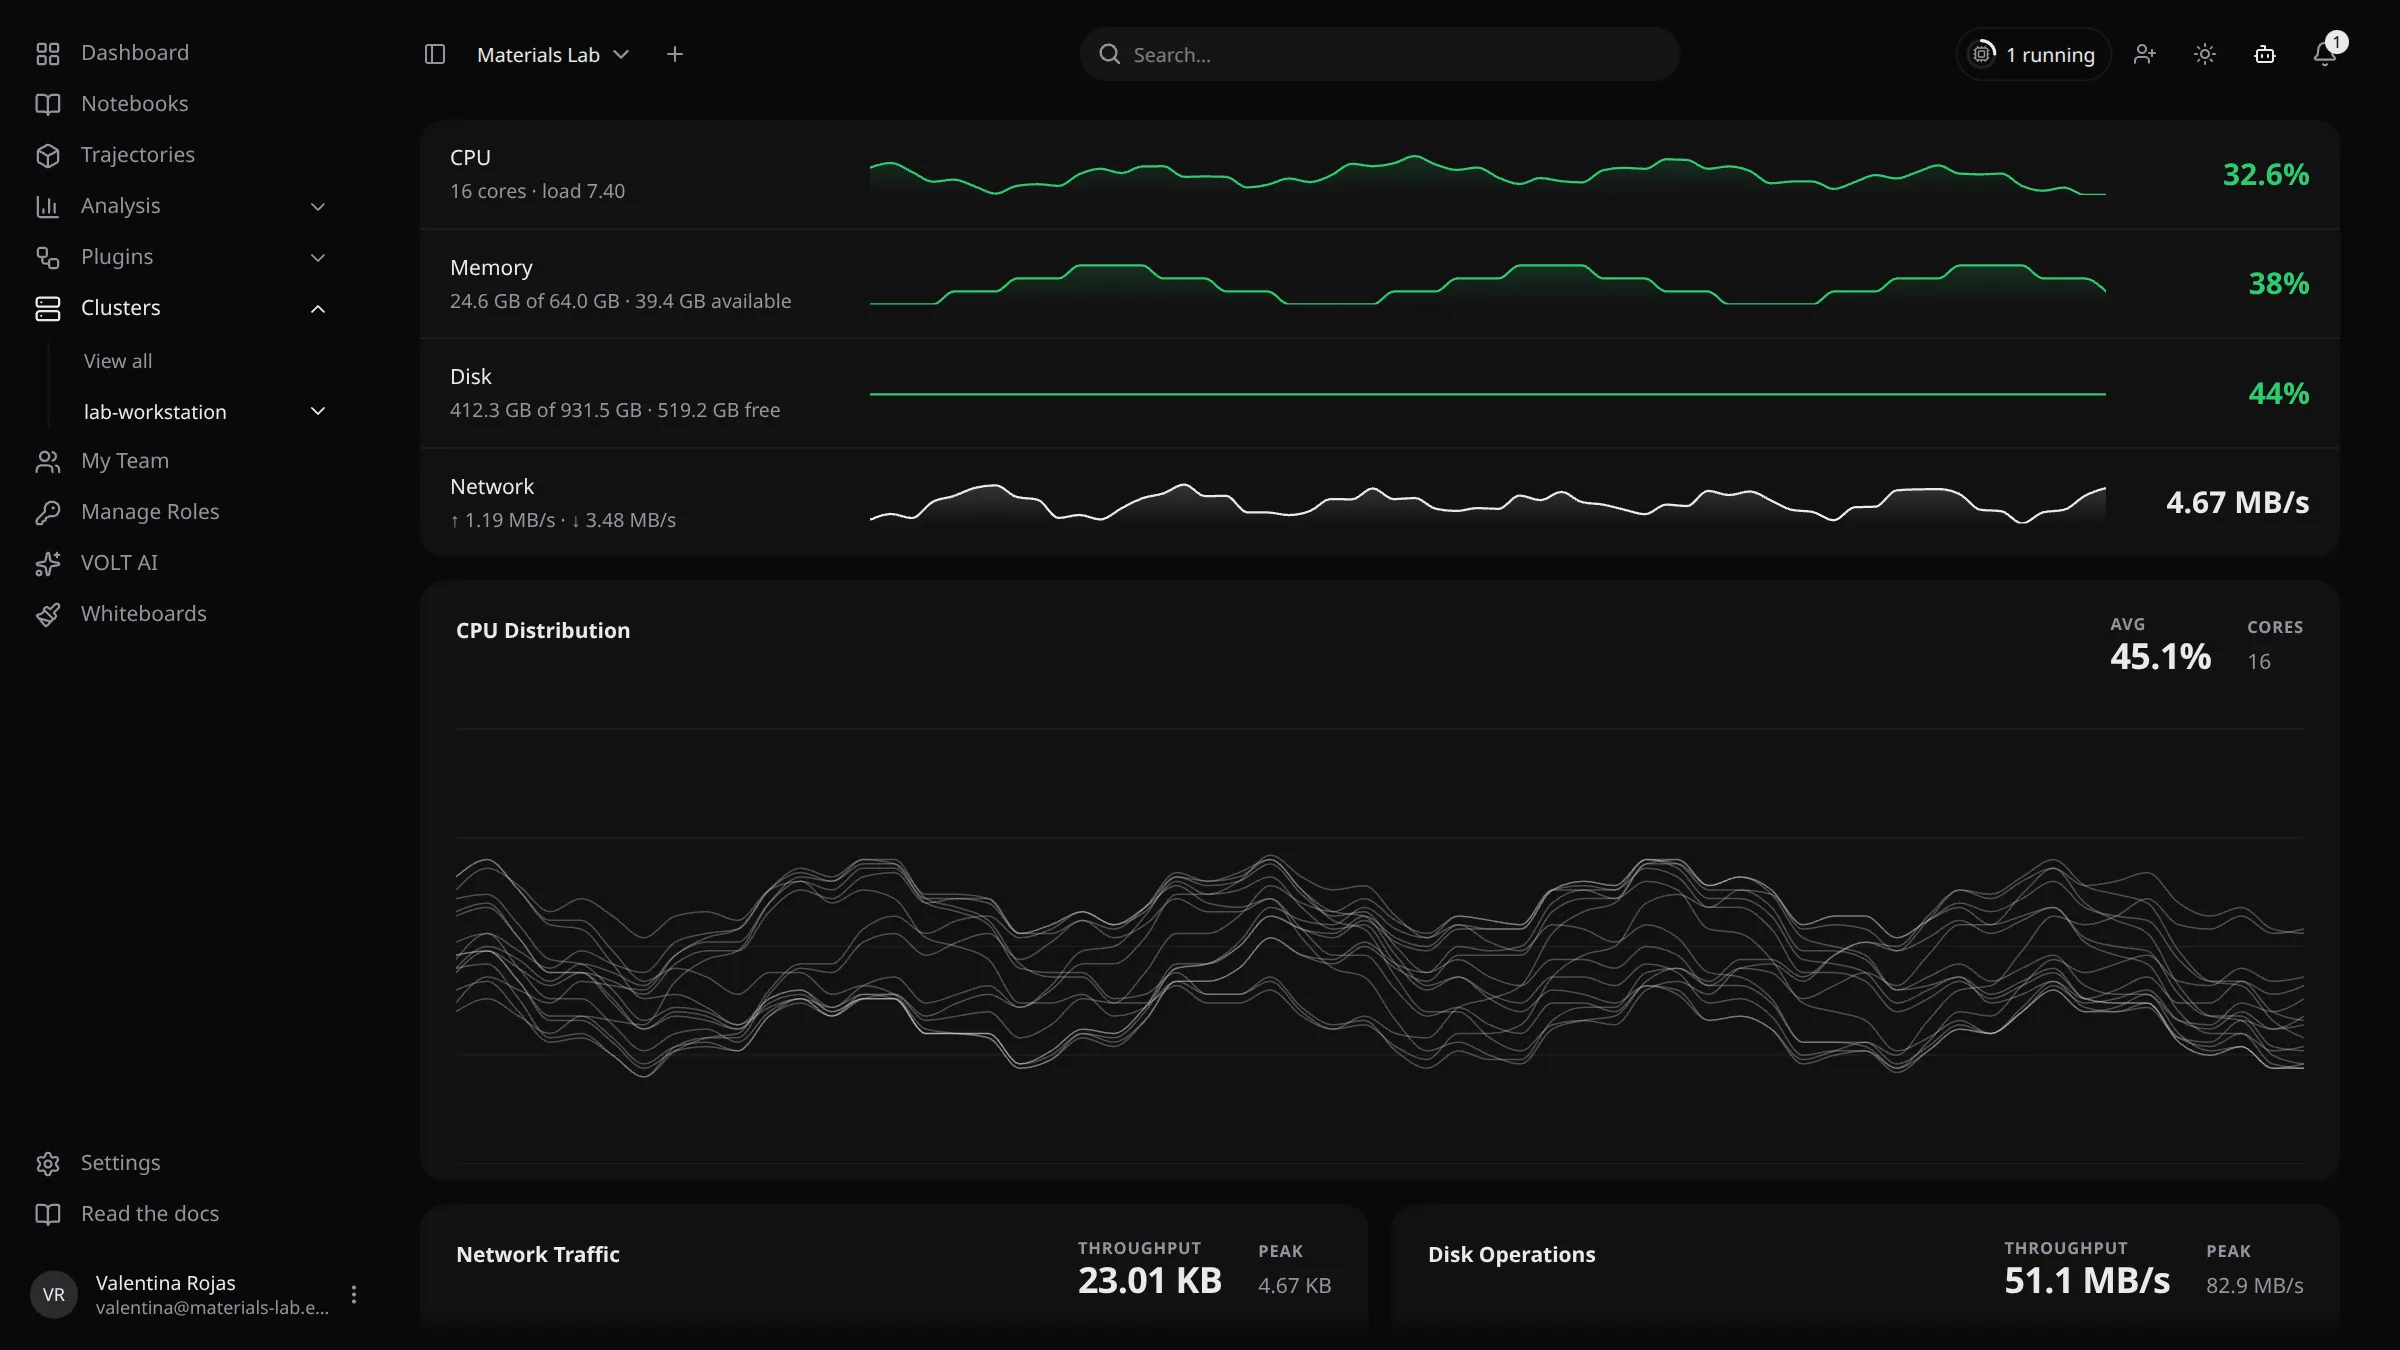
/dashboard/clusters/:clusterId (titled <name> - Monitoring) shows one cluster's live resources. It loads the last five minutes of heartbeats, then adds each new one as it arrives. The daemon reports every 10 seconds by default.
| Section | Shows |
|---|---|
| CPU | Usage, number of cores and the 1-minute load average. |
| Memory | Used and total GB, and GB available. |
| Disk | Used and total GB, and GB free. |
| Network | Total throughput, with outgoing and incoming rates. |
| CPU Distribution | One line per core over time, with the average usage (Avg) and the number of Cores. |
| Network Traffic | Incoming and outgoing traffic over time. |
| Disk Operations | Read and write throughput over time, with the current Throughput and the Peak, in MB/s. |
The first four rows each have a sparkline of the loaded history. The CPU, Memory and Disk values turn amber from 60% and red from 80%. If the cluster has not reported yet, the page says so (Pending) instead of showing charts.
Operations
Change the runtime role
Change runtime role opens Runtime role for <name>. Pick a role and click Save role.
| Role | Runs jobs | Owns data |
|---|---|---|
| Cluster (Compute + storage) | Yes | Yes |
| Storage server (Storage only) | No | Yes. It accepts writes and serves downloads. |
| Compute node (Compute only) | Yes, reading and writing data on other clusters | No |
The dialog shows the Desired role you saved and the Effective role the daemon applies. A connected daemon converges right away, draining compute or storage work first when it has to. An offline cluster applies the new role the next time it connects.
Edit queue concurrency
Edit queue concurrency opens Queue settings for <name>: how many jobs of each kind the cluster runs at once. Each value is a whole number of at least 1.
| Field | Jobs |
|---|---|
| Analysis | Workflow analysis jobs |
| Rasterizer | Trajectory preview generation |
| GLB preprocessing | Trajectory model preprocessing |
| Artifact upload | Analysis artifact upload jobs |
| Plugin warmup | Plugin binary preparation jobs |
Under Execution scope limits, you can also cap how many jobs of a kind run at once for a single trajectory (Analysis processing, Artifact upload, Rasterization, GLB preprocessing). Use 0 for no limit. Click Save queue settings.
Transfer data to another cluster
Transfer storage + listing state moves everything a cluster owns to another cluster. It is available while the source is connected and serves storage. In Transfer cluster data for <name>, pick a Destination cluster: only connected clusters that accept storage writes are offered. Then click Queue transfer.
VOLT queues one transfer job per trajectory, analysis and plugin binary the source owns. Each job goes through Queued, Freezing, Copying, Verifying, Switching and Cleaning, and ends Completed, Failed or Cancelled. Once the destination holds a verified copy and becomes the owner, VOLT deletes the source's copy and purges the related tables on the source daemon. Keep the source connected until the copy and the verification finish. Recent transfer jobs in the same dialog shows the latest jobs with their object counts and errors.
Show the install command again
Show install command is available while the cluster is Waiting for connection or Healthcheck received. It issues a new enrollment token and shows a fresh Install command. A command you copied earlier stops working.
Delete a cluster
Delete cluster asks for your account password.
- A connected cluster is asked to uninstall itself and shows Deleting. VOLT removes it once the daemon confirms the cleanup or disconnects. After two minutes without either, it becomes Delete failed.
- A cluster that isn't connected is removed from VOLT at once. Because VOLT cannot reach the machine, the dialog may show a manual uninstall command to run on it.
Password confirmation needs an account password. If you only sign in with GitHub, Google or Microsoft, set a password under Authentication first.
Deleting a cluster does not move the data it owns. If the team should keep that data, transfer it to another cluster first.
How VOLT picks a cluster
When work needs a cluster, the server chooses among the connected clusters whose effective role allows it: compute for jobs, storage for new data. It prefers the least-loaded machine, weighing CPU, memory, disk and network use from the latest heartbeats. For storage, it avoids clusters whose disk is 85% full or more, and more strongly from 92%.
When a cluster goes offline
When a cluster's daemon disconnects, its status becomes Disconnected and:
- data it owns (trajectory files, analysis results, plugin binaries) cannot be read. A request for it waits up to 30 seconds for the daemon to reconnect, then fails;
- new jobs go to the other connected clusters that can take them. If none can, the request fails with a message that a connected compute-capable (or storage-capable) team cluster is required;
- notebooks assigned to it cannot open until it reconnects;
- if it was the team's last connected cluster, dashboard pages send you to cluster setup until a cluster connects.
When the daemon reconnects, the cluster becomes Connected again and its data is available. Its jobs are listed under Jobs.