Quickstart
Start VOLT, upload a trajectory and run your first analysis in a few minutes.
This walkthrough uses a workspace that runs on your own computer, so there's nothing to set up and no account to create. On a server your group runs, the steps from Upload a trajectory on are the same.
Start VOLT
Install the desktop app and open it, or open a VOLT web client and choose Run in this browser (Run in the browser).
The first start lists its phases (Start API server, Provision workspace, Start compute daemon), creates a local account, a team and a cluster, and opens the dashboard signed in. A default set of analysis plugins then installs from the registry in the background.
Upload a trajectory
Drop a simulation file anywhere on the dashboard, or choose Upload. VOLT reads LAMMPS text, binary and YAML dumps, LAMMPS data files, XYZ and extended XYZ, and ZIP archives of these. It tells them apart by content, so extensions don't matter. A file with many frames is split into one frame per timestep.
No file at hand? A team with no trajectories shows Download sample simulations: it saves the sample files to your computer, and you upload them like any other file.
See Trajectories for folders, multi-file uploads and large files.
Wait for processing
The card's caption shows the processing stage (Queued..., Processing frames...): the cluster compresses each frame, builds its 3D model and renders the card's preview. When the caption reads the atom and frame counts, every frame is done and the trajectory opens in the canvas.
Open it in the canvas
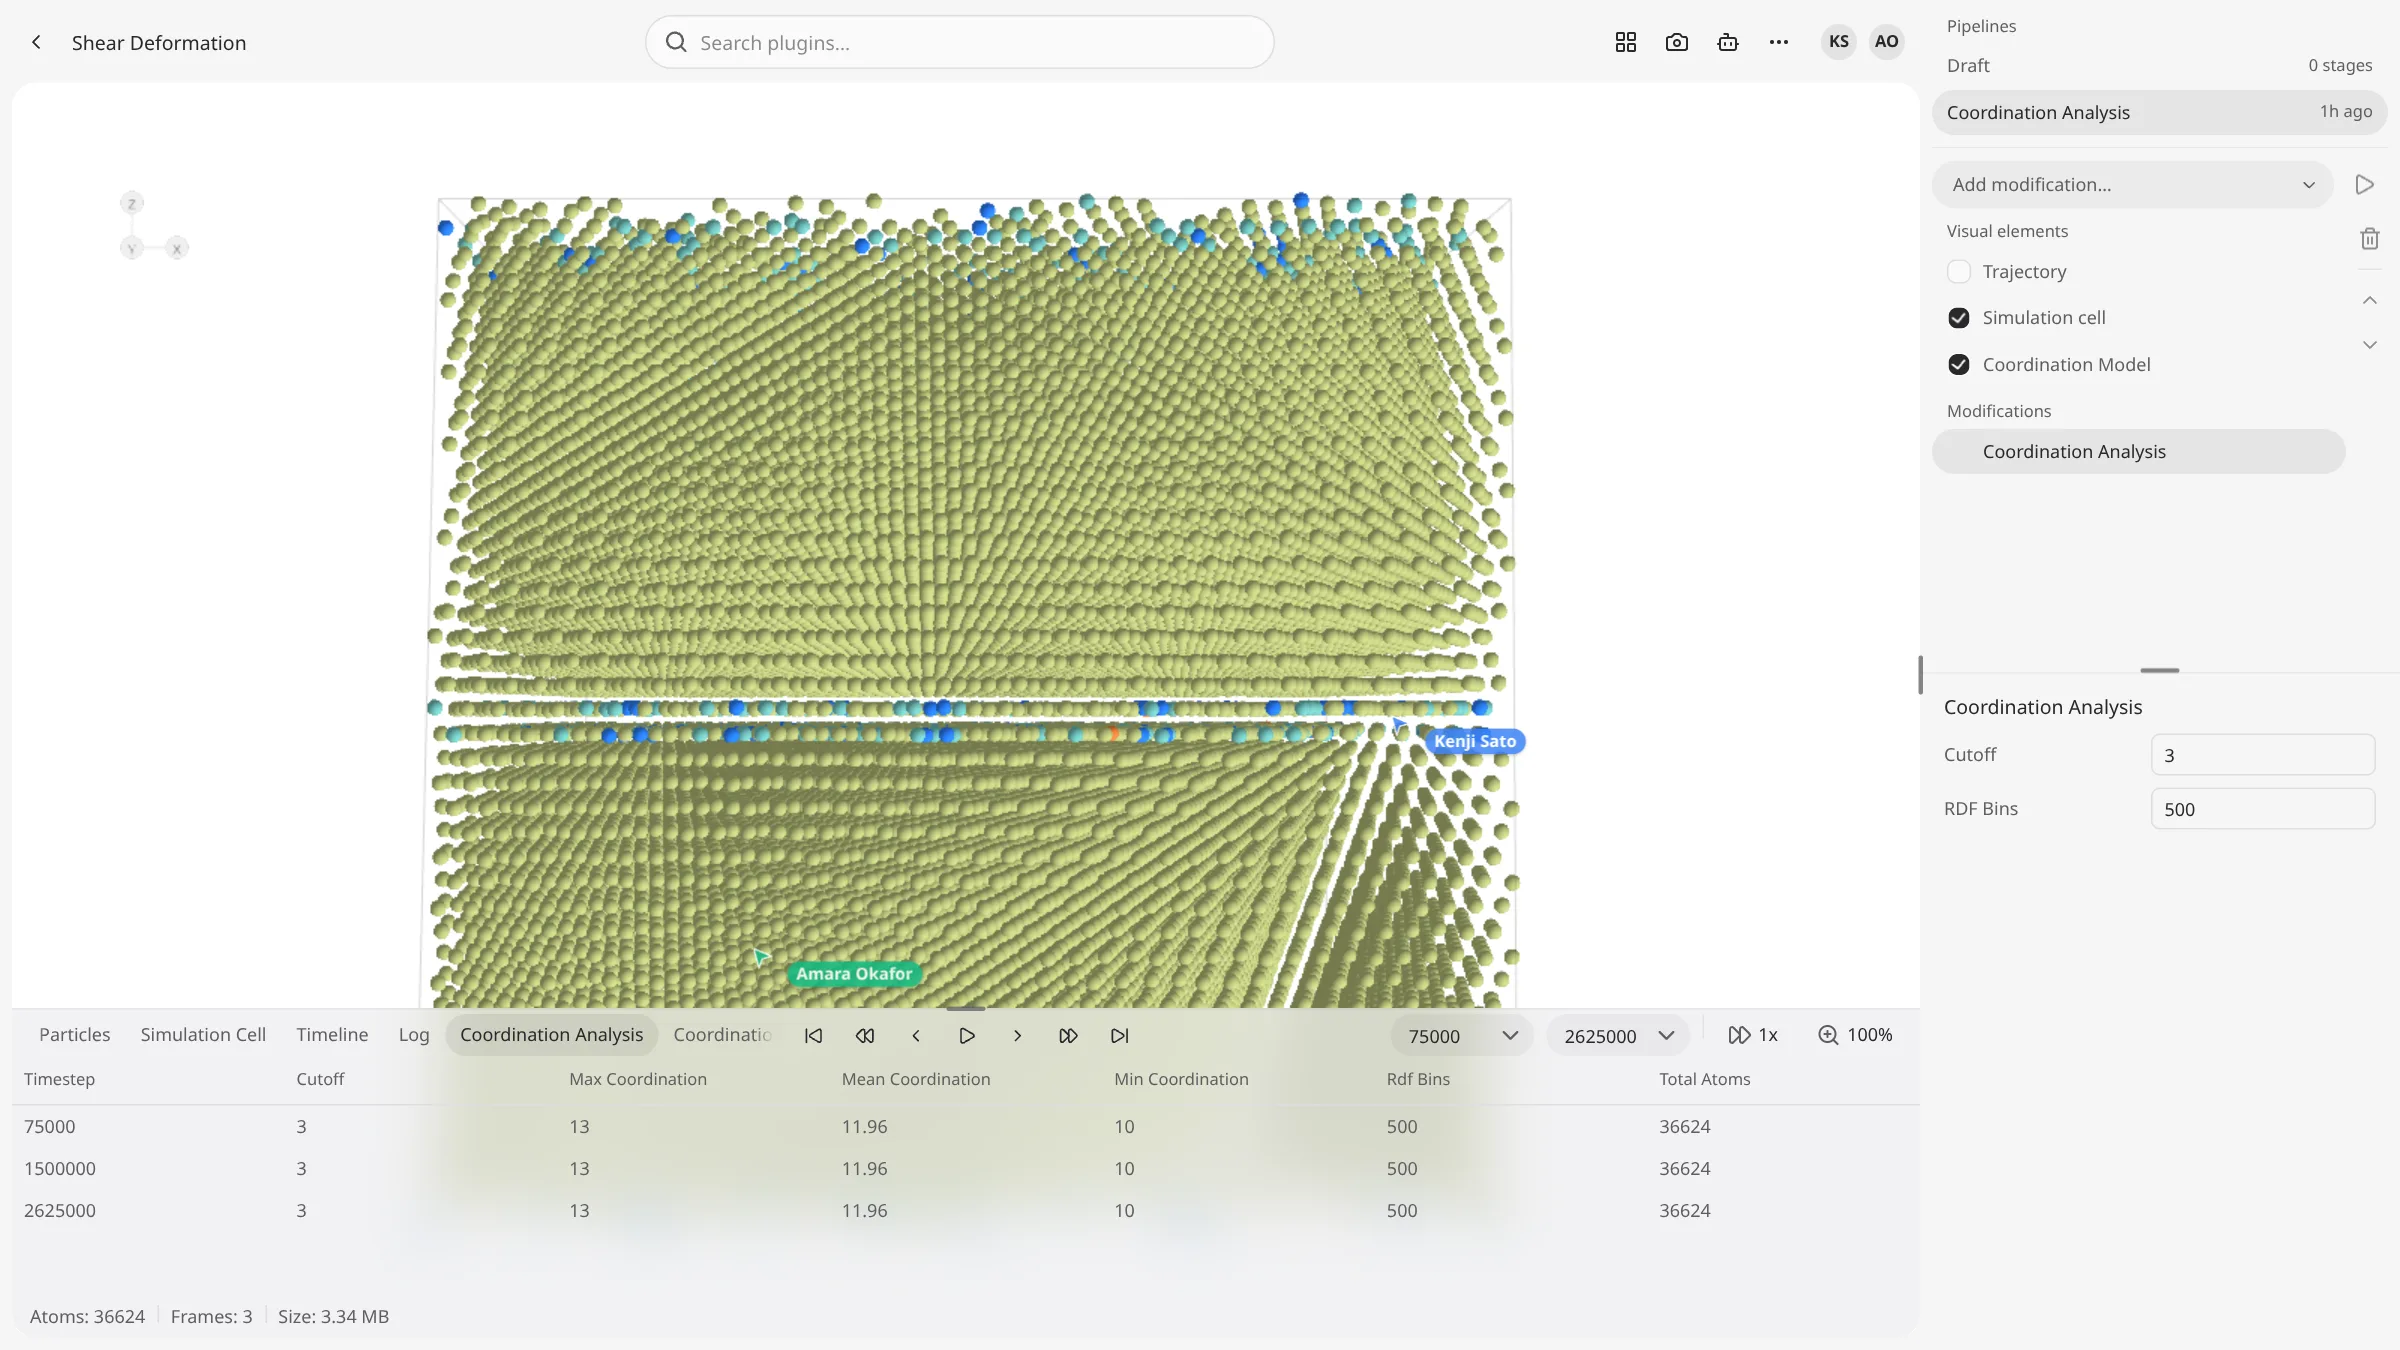
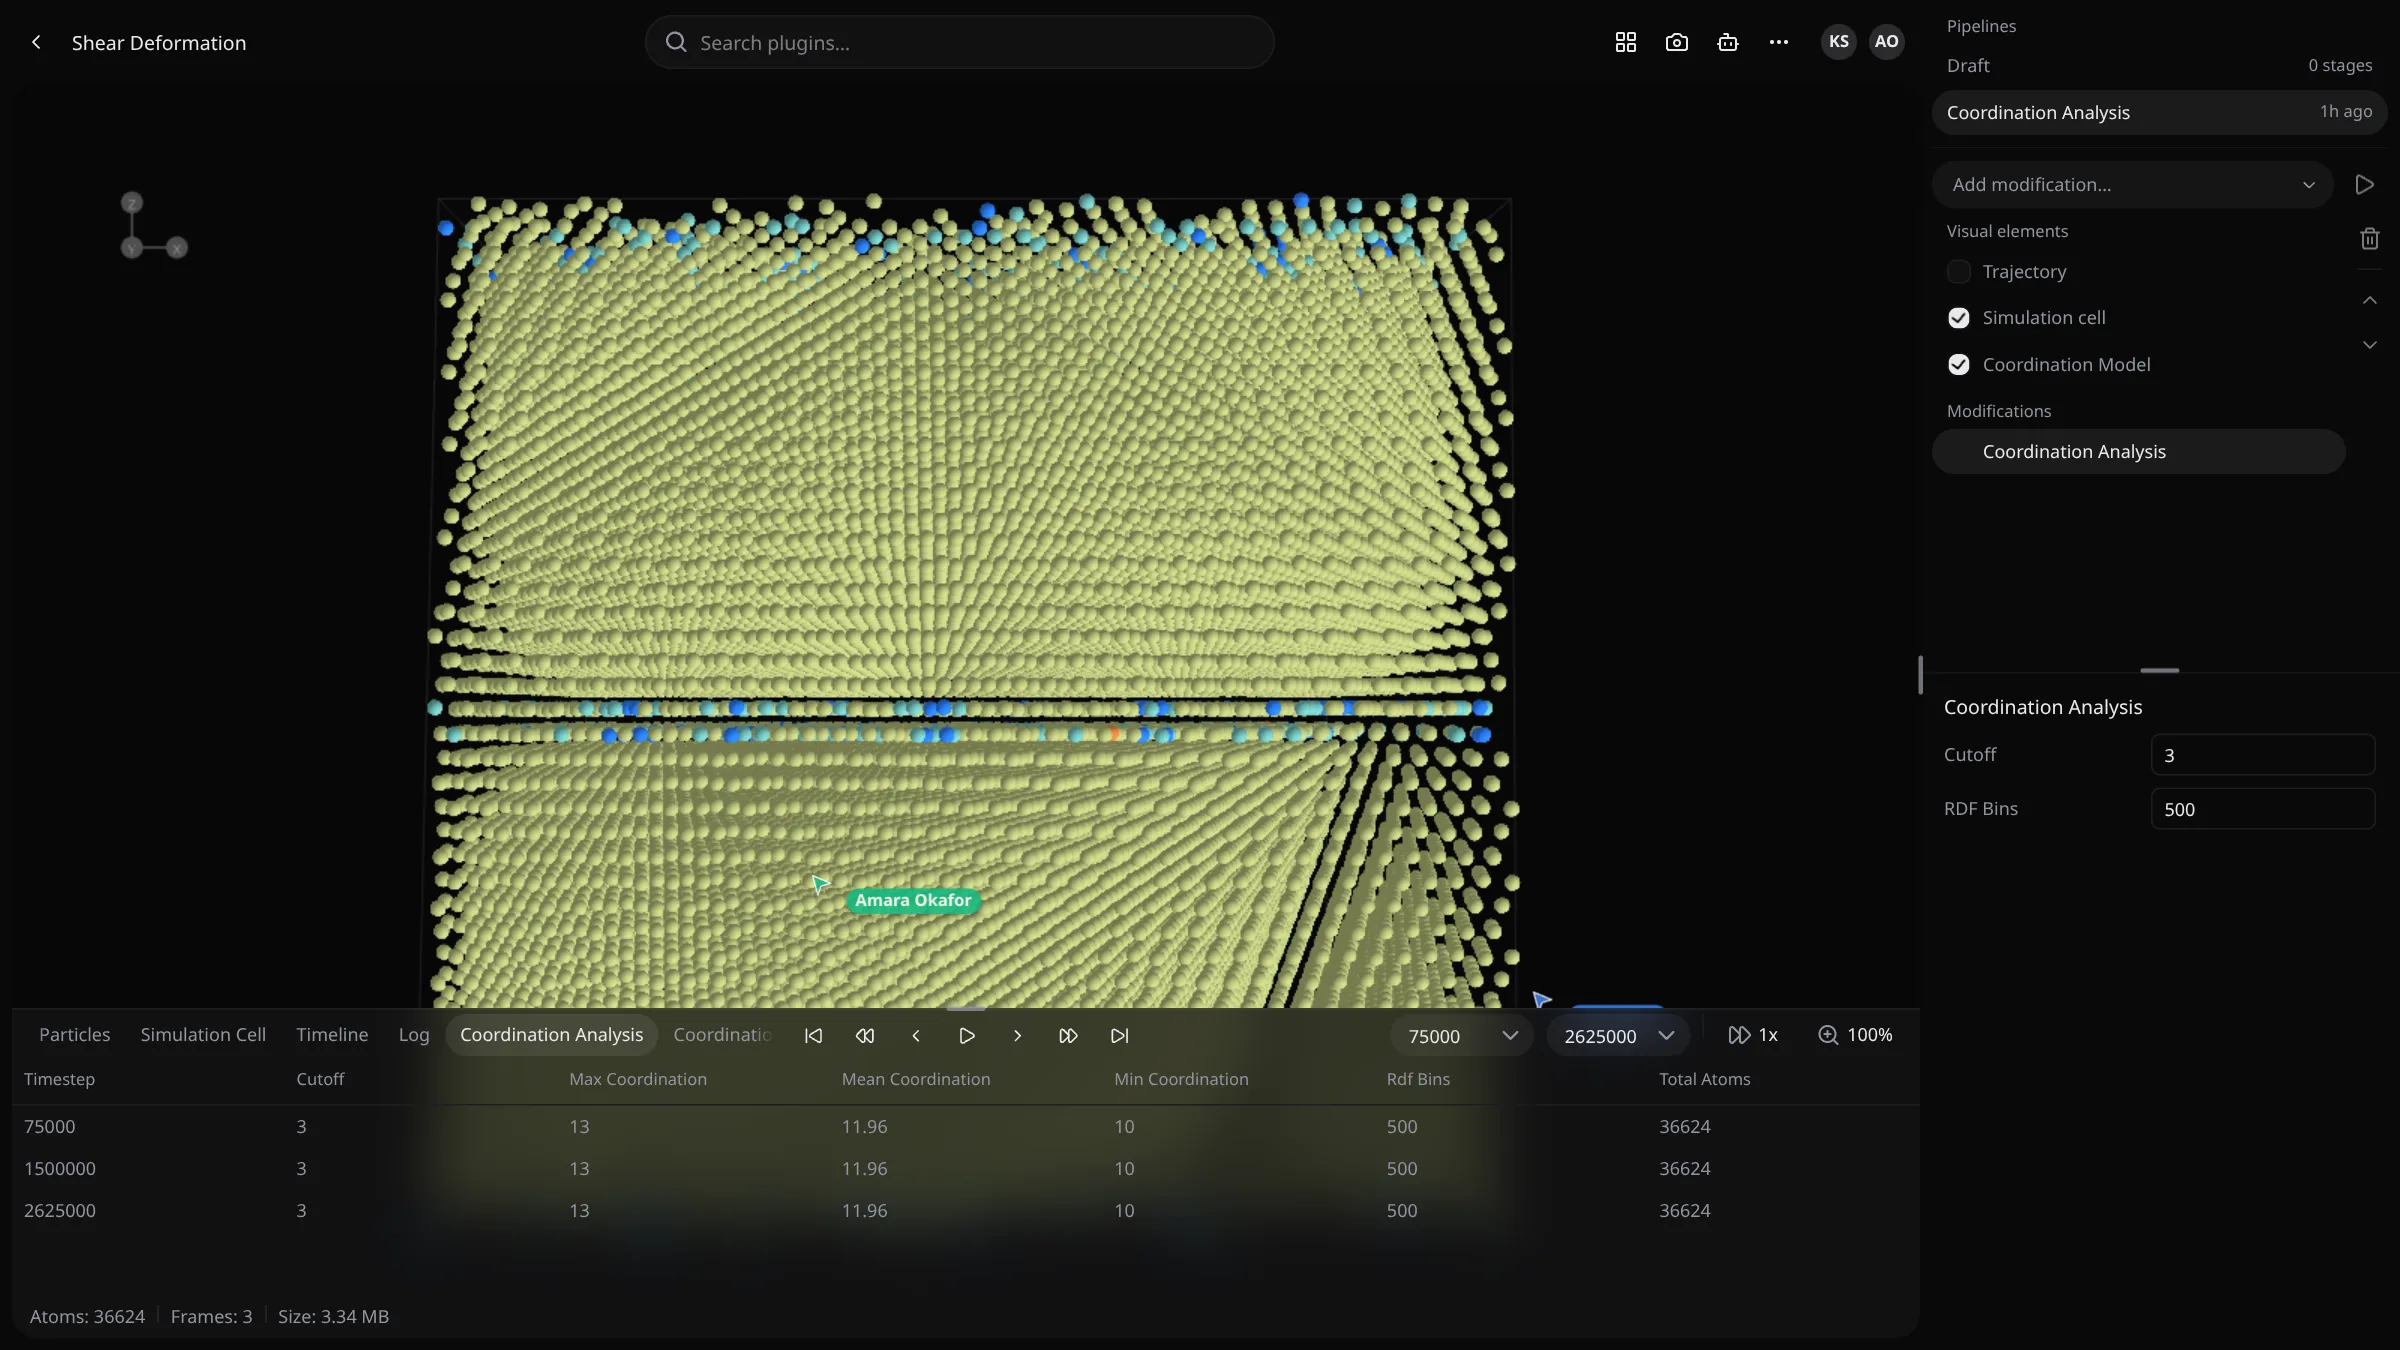
Click the card. The canvas shows the first frame in 3D. Drag to orbit, scroll to zoom, and play or scrub the frames from the timeline at the bottom.
Add an analysis
In the pipeline panel at the right, open Add modification… and pick a plugin, for example Polyhedral Template Matching, which classifies the crystal structure of every atom. Its parameters appear below the lists; the defaults are a good start.
If the plugin isn't in the menu yet, its default install hasn't finished, or your workspace doesn't have it: install it from Plugins › Marketplace (Plugins).
Run the pipeline
Press the run button (▶) next to Add modification…. Under Selected Timesteps keep the frame on screen, pick several, or clear the field to run on every frame. Press Execute.
The Log tab of the timeline follows the run frame by frame.
Read the results
When the analysis completes, its 3D model appears under Visual elements: click it to draw the atoms colored by structure. Its summary tables show under Results, and its listings open as tabs in the timeline. See Analysis results.
Where to go next
- Chain more stages. Add a slice plane, an expression selection or another plugin, and run again. The analyses already computed are reused. See Pipelines & analyses.
- Extend the run you just made, or change its parameters and run it as a new pipeline. See Pipelines & analyses.
- Find the right algorithm in the plugin catalog.
- Work in Python with Notebooks or the Python SDK.
- Set up a server for your group with Self-hosting.