Canvas
The 3D workspace where you look at a trajectory, build and run pipelines, and read their results.
The canvas is where you work on one trajectory. It shows the frames in 3D, plays them back, and holds the
pipeline panel, in the style of OVITO's pipeline editor, where you add modifications, run analyses and pick
which results to draw. It opens at /canvas/:trajectoryId, from a trajectory card, a listing row or a search
result, once the trajectory has finished processing.
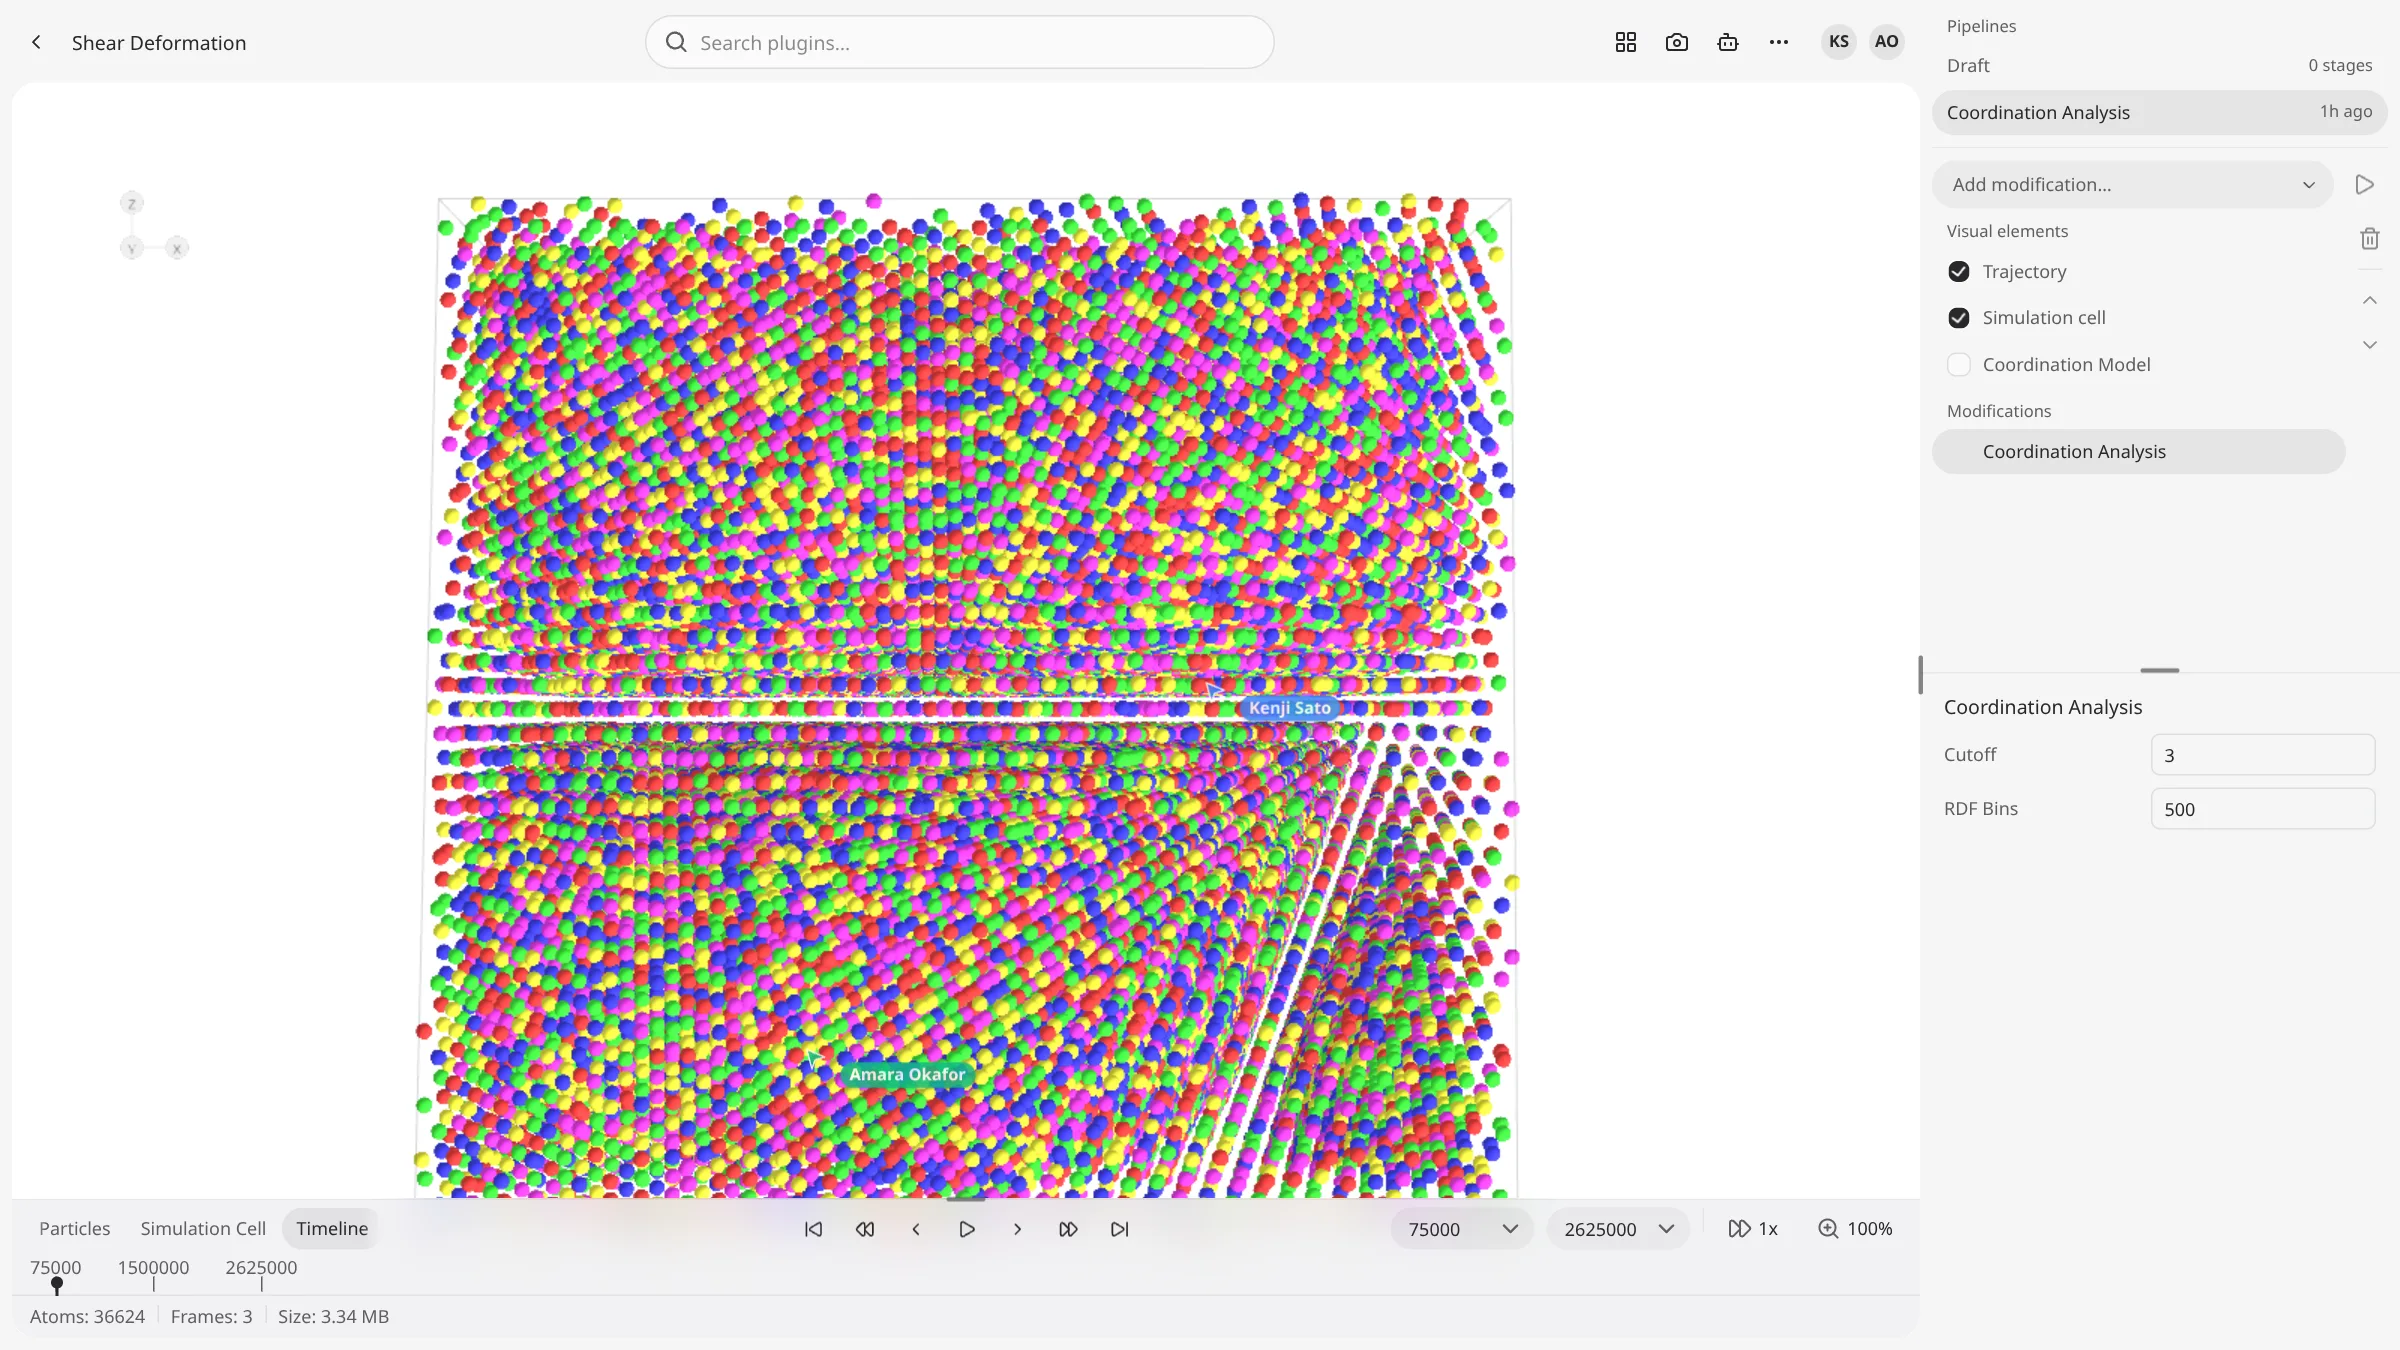
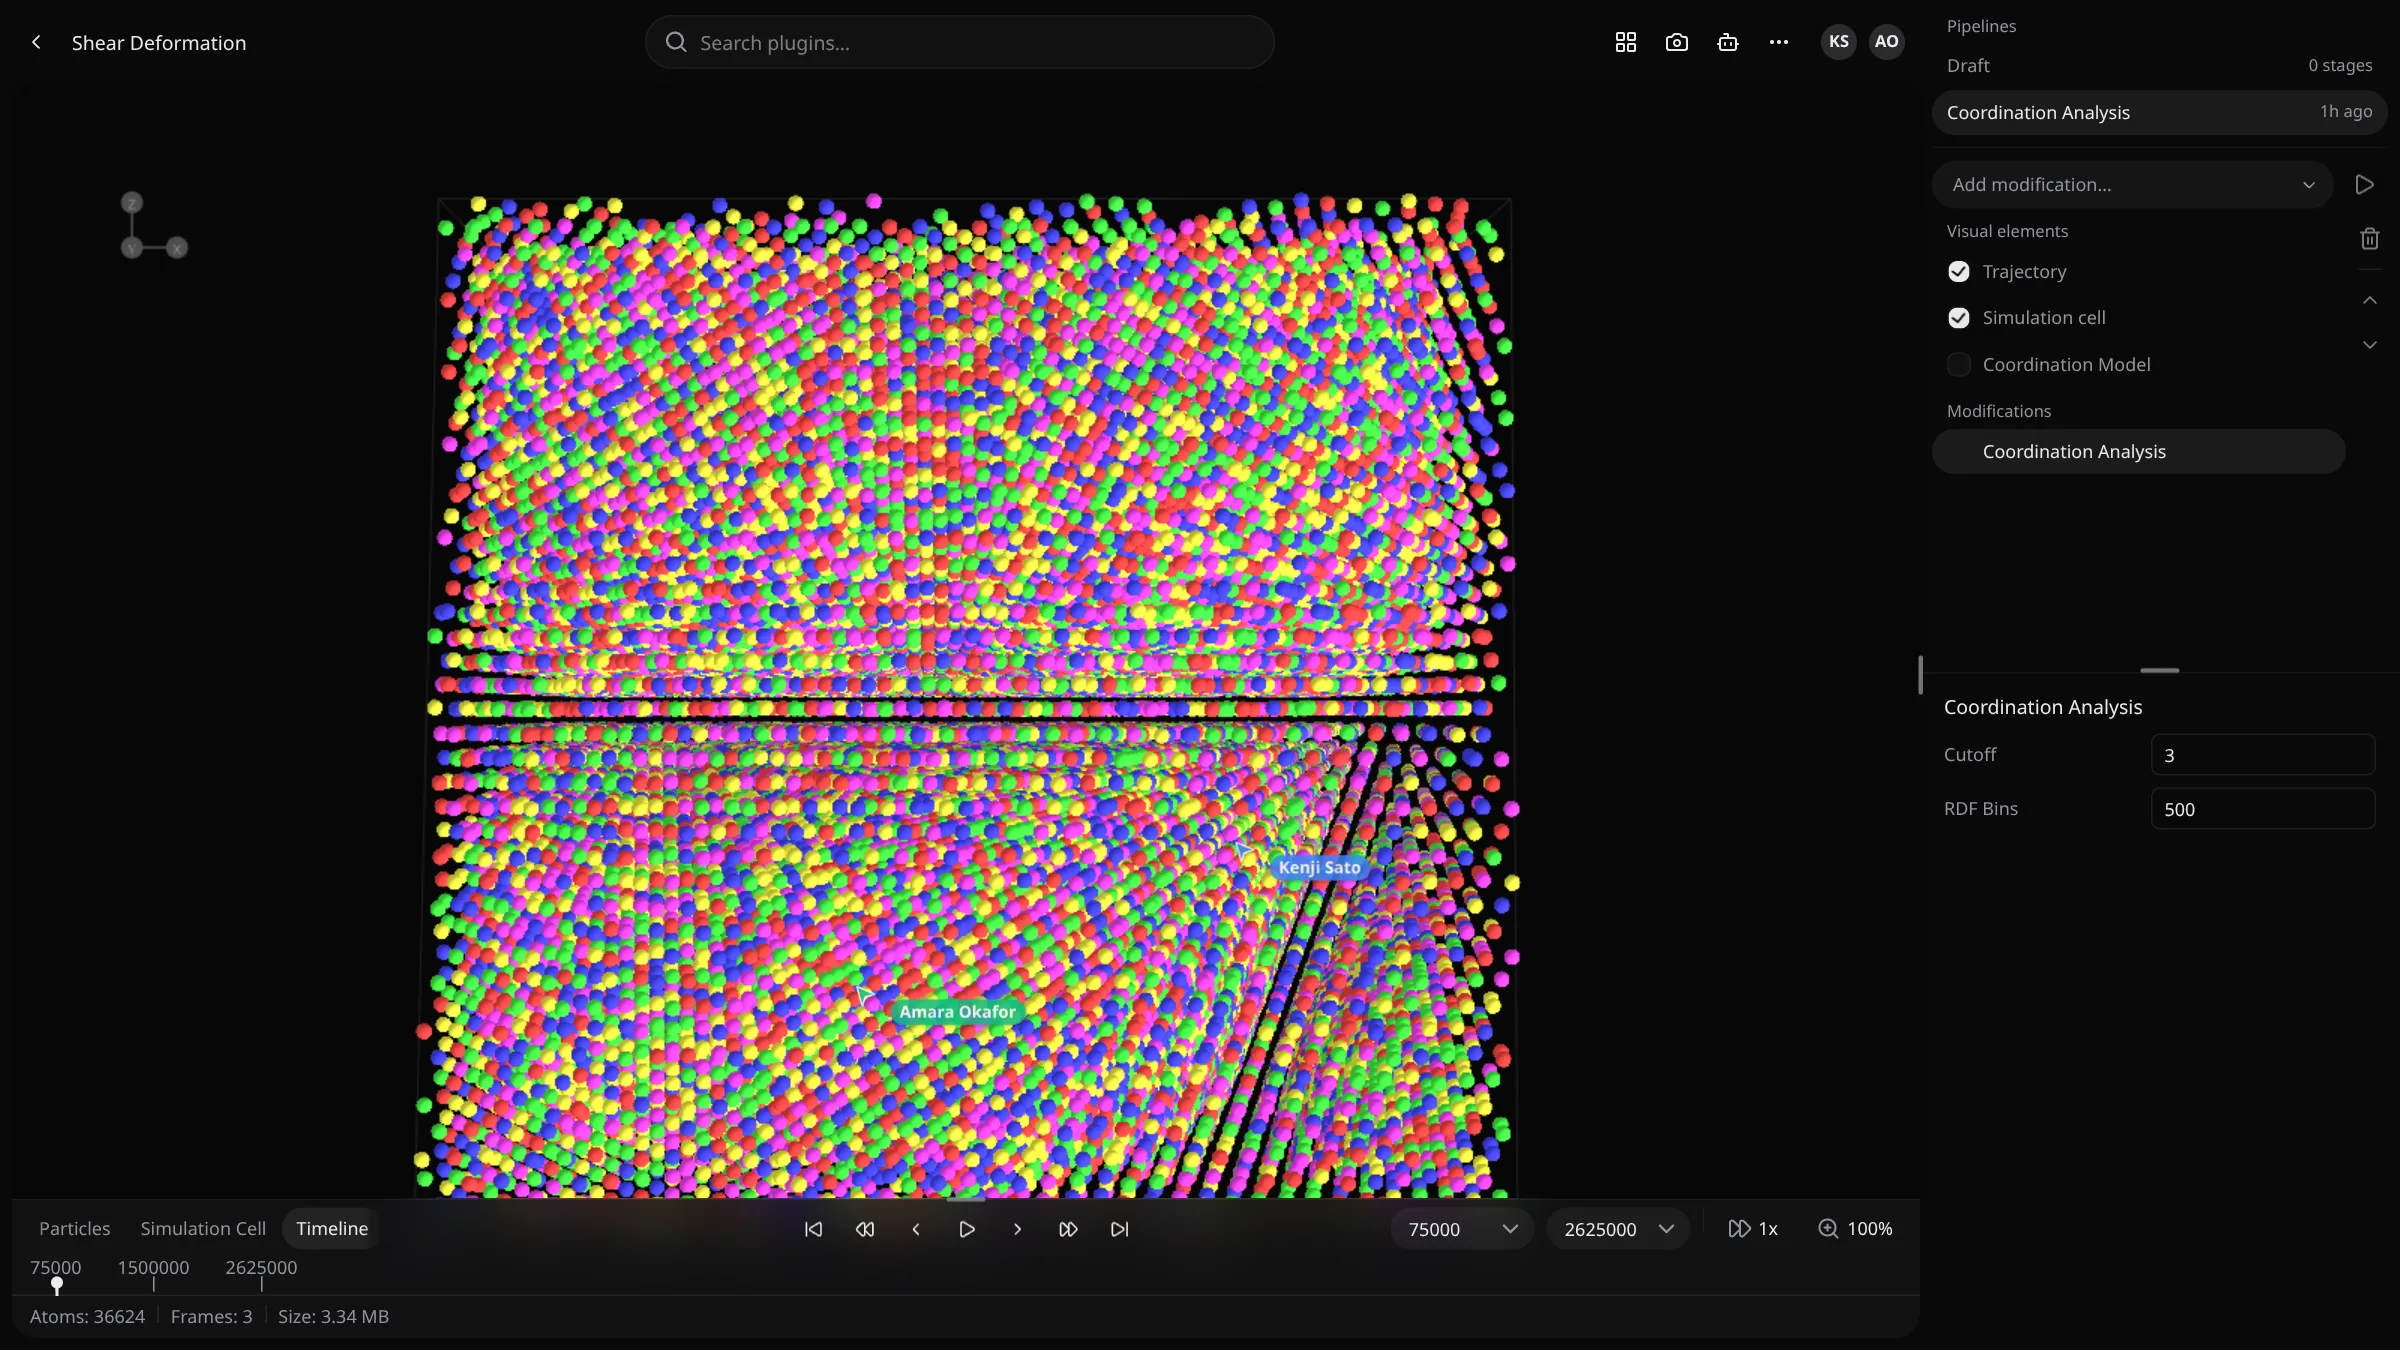
Members of the trajectory's team can change everything on the canvas. Anyone else who opens a public trajectory gets a read-only view.
Layout
| Region | What it holds |
|---|---|
| Toolbar | Back to the dashboard, the trajectory's name, the plugin search, scene and export actions |
| Viewport | The 3D scene, in one pane or up to four |
| Timeline | Docked at the foot of the viewport: playback, the frame ruler and tabs with tables and logs |
| Pipeline panel | At the right: the pipelines, their visual elements and modifications, and the settings of the selected item |
Drag the edge of the pipeline panel to make it wider or narrower, and the top of the timeline to make it taller. Both sizes are remembered in your browser.
Toolbar
| Control | What it does |
|---|---|
| Back to dashboard | Returns to the folder the trajectory is in |
| Trajectory name | Double-click to rename the trajectory |
| Search plugins… | Adds a plugin as a stage of the pipeline on screen. See Plugin search. |
| Add scene pane | Splits the viewport into another pane, up to four |
| Screenshot settings | Captures the viewport as a PNG. See Screenshots. |
| VOLT AI | Opens the assistant, for signed-in users. See VOLT AI. |
| More actions (…) | Download analysis as CSV (once the current analysis has completed), Share trajectory (signed-in users) and Light mode / Dark mode |
| Avatars | Teammates on this canvas. See Collaboration. |
Share trajectory opens the visibility switch and the canvas link. See Public sharing.
Viewport
Drag in the viewport to orbit the camera and scroll to zoom. Press R to reset the camera.
- The axis gizmo in the top-left corner shows the orientation. Shift G hides or shows it.
- G toggles a ground grid, off by default.
- Ctrl = and Ctrl - make the particles larger or smaller, for every point cloud on screen.
- Ctrl Z and Ctrl Shift Z undo and redo changes to the scene.
While a frame loads, the toolbar, the pipeline panel and the timeline are already in place, and an overlay on the viewport reads Loading timestep N with the frame's atom count. A trajectory whose upload left no frames shows No timesteps yet, and one whose ingestion failed shows Couldn't process this trajectory with Back to trajectories.
Scene panes
Add scene pane adds an empty pane next to the current one, up to four (two side by side, then a 2 × 2 grid). Each pane is labeled Pane 1, Pane 2…, and shows its own set of visual elements. Click a pane to focus it: the pipeline panel then adds and removes elements in that pane, and playback and screenshots act on it. Close pane (×) removes a pane.
Pipeline panel
The panel follows OVITO's layout, top to bottom:
- Pipelines: the draft and every saved run of this trajectory. The rest of the panel shows the one you select.
- Add modification… and the run button (▶).
- Visual elements: what the selected pipeline can draw.
- Modifications: its stages, the newest on top.
- The settings of the item you select in the lists above.
How pipelines run, and what extending or re-running one does, is described in Pipelines & analyses. This section covers what the panel shows.
Pipelines
The list starts with Draft, the pipeline you are building, with its number of stages. Below it are the saved
runs, newest first, each named after its analyses (Polyhedral Template Matching → Coordination Analysis) unless
you renamed it. Next to each run is its state: Queued, Running or Failed while that applies,
In view when the scene shows its results but another pipeline is selected, otherwise how long ago it ran.
Right-click a run for Duplicate into draft, Rename and Delete, and the draft for Clear draft.
Analyses that ran outside any pipeline, for example through the API, are grouped under Ungrouped.
Visual elements
| Row | What it draws |
|---|---|
| Trajectory | The atoms of the current frame |
| Simulation cell | The cell of the current frame. See Simulation cells. |
| One row per model | Every 3D result of the selected pipeline's analyses: atoms colored by structure, meshes, dislocation lines… |
Click a row to show that element and select it. Selecting an analysis's model also makes that analysis the current one, and moves to the nearest frame it was computed for. Tick a row's checkbox to add the element to what is already on screen, drawn in the same place; untick it to remove it.
A model that is still being produced shows Pending, and one that failed shows Failed. Right-click a model for Download, which saves its listing as JSON.
Modifications
The list holds two kinds of rows:
- Stages you can still edit: every stage of the draft, or the stages you added to a saved run. Their checkbox enables or disables them; for slice planes and analyses it works once they have run. An analysis stage that hasn't run yet shows Not run. Drag these rows to reorder them, or use Move modification up and Move modification down at the right. Delete modification, or Delete in the right-click menu, removes one.
- Stages a saved run already ran: a record of what it did. An analysis shows cached when its result came from an earlier run, and edited when you changed its parameters. Right-click an analysis for Download (its results as a CSV, or a ZIP of CSVs, once it has completed) and Delete (the analysis and its results). An analysis whose results aren't loaded at the current frame is grayed out.
With nothing in it, the list reads No modifications yet. Add one above.
Item settings
The area below the lists shows the settings of the selected row:
| Selected | Settings |
|---|---|
| Trajectory | Opacity and Color, with Reset to drop the color |
| Simulation cell | Opacity |
| A model | Opacity and Color; Particle size for atoms, Line width for lines, Show edges for meshes |
| An analysis | Its state (Queued, Running, Failed), its parameters, and Results, the tables the plugin shows for the current frame |
| A modification you can edit | Its editor. See Stage types. |
| A slice or expression stage of a saved run | The values it ran with |
| A grayed-out analysis | The values it ran with, and No results at this timestep. |
An analysis of a saved run shows its parameters as fields you can change, to run the pipeline again as a new one. See Changing a saved run's parameters.
Particle size is one multiplier for every point cloud on screen, the same one Ctrl = and Ctrl - change.
Baked models
When the trajectory has baked color-coding models or particle-filter models, sections named Color Coding and Particle Filter appear at the foot of the panel, grouped by timestep. Click one to show it at its timestep. Right-click it for Add to scene / Remove from scene, Transparency and Color.
Timeline
The timeline sits at the foot of the viewport. Its header has the tabs on the left, the playback controls in the middle, and the range, speed and zoom on the right.
Tabs
| Tab | Content |
|---|---|
| Particles | A table of the atoms of the current frame, with the current analysis's per-atom properties when there is one |
| Simulation Cell | The current frame's cell, Show PBC images and Edit Cell |
| Timeline | The frame ruler |
| Log | The current analysis's output for the current frame. Shown when an analysis is selected. |
| One tab per listing | The current analysis's results tables, one tab per exposure that has a listing, named after it. Right-click a tab for Download. |
In a listing tab, right-click a row for Inspect Atoms, one View … entry per sub-listing (opened in the tab, with Back to listing) and Delete. See Analysis results.
Playback
| Control | Key |
|---|---|
| Jump to start | Home |
| Back 10 timesteps | Shift ← |
| Previous timestep | ← |
| Play / Pause | Space |
| Next timestep | → |
| Forward 10 timesteps | Shift → |
| Jump to end | End |
The first time you press Play, the canvas caches the frames for smooth playback, up to 100 of them, without covering the viewport. Meanwhile the Play button becomes Cancel caching with a ring that fills as frames are cached, the status bar reads Caching timesteps for playback · N of M, and a band under the ruler marks the frames already cached. Playback then loops through the range.
- Start timestep and End timestep set the range that playback loops through and the ruler shows.
- The speed menu sets the playback speed, from 0.25x to 10x. = and - step it up and down.
- The zoom menu sets the camera zoom, from 25 % to 400 %.
Click or drag on the ruler to move to a frame. While an analysis is selected, its ticks are colored by the state of that analysis at each frame, and frames it wasn't computed for are dimmed.
Log
The Log tab shows what the selected analysis's plugin printed for the current frame, live while the frame runs. Before that it reads Frame is queued for execution. or Waiting for plugin output.... When you run a pipeline that computes anything, the canvas switches to this tab and follows the run from one stage to the next.
Status bar
Under the timeline, the status bar shows the trajectory's Atoms, Frames and Size. Hide it with Toggle status bar in the command palette.
Screenshots
Screenshot settings in the toolbar opens:
- Resolution: Viewport, HD · 1280 × 720, Full HD · 1920 × 1080, 4K · 3840 × 2160 or Custom (Width and Height, from 64 to 8192 px).
- Angle: Current view, Front, Back, Left, Right, Top, Bottom, Isometric or Ground isometric.
- Capture screenshot saves a PNG of the focused pane. Ctrl S captures again with the last settings.
When the trajectory has finished pipelines, Batch figures lists them with a switch each (Select all / Clear). Capture N pipelines shows each selected pipeline's results the way the current scene is set up, captures it, and restores your scene at the end.
Command palette and shortcuts
Ctrl K opens the command palette. Type to filter, press Enter to run a command. It lists every action below, including those without a key: Download all analyses (every completed analysis of the trajectory, as a ZIP), Toggle status bar, Start guided tour, Read the docs and Release notes.
| Keys | Action |
|---|---|
| Space | Play / Pause |
| ← / → | Previous / next timestep |
| Shift ← / Shift → | Back / forward 10 timesteps |
| Home / End | First / last timestep |
| = / - | Increase / decrease speed |
| G | Toggle grid |
| Shift G | Toggle gizmo |
| R | Reset camera |
| Ctrl = / Ctrl - | Increase / decrease point size |
| Ctrl Z / Ctrl Shift Z | Undo / redo |
| Ctrl K | Open command palette |
| Ctrl S | Screenshot |
| Ctrl I | Import trajectory (opens the file picker) |
| Ctrl A | Focus the plugin search |
| F11 | Toggle fullscreen |
| Escape | Close the command palette |
The canvas shortcuts use the Ctrl key, on macOS too. They don't fire while you type in a field.
Plugin search
Search plugins… in the middle of the toolbar lists the team's installed plugins by name. Start typing a name anywhere on the canvas, or press Ctrl A (⌘ A on macOS), to search. Keys bound to a shortcut, such as G and R, keep doing their shortcut. Pick a plugin to add it as an analysis stage of the pipeline on screen and set its parameters in the panel. The search is shown to team members only.
Collaboration
Teammates who have the same trajectory open appear as avatars in the toolbar. Click one to join that person's
session at /canvas/:trajectoryId/workspace/:ownerId:
- A banner reads You are viewing their name's session. Your view follows theirs: what is on screen, the frame, playback, opacity and colors, panes and render settings.
- Your edits to the scene go to their viewport too.
- Each person's pointer is drawn over the viewport.
- Leave takes you back to your own canvas. When the owner closes their canvas, you return to yours.
Collaboration is for members of the trajectory's team. It is off on single-user deployments.
Public canvases
A public trajectory opens for anyone with its link, signed in or not. People outside the team get a read-only canvas:
- They can play the frames, move the camera, show and hide visual elements, open the timeline tabs and take screenshots.
- The plugin search, Add modification… and the run button are not available, and saved runs are not listed: existing analyses appear under Ungrouped.
- Share trajectory and VOLT AI are shown only to signed-in users.
A private trajectory opened by someone outside its team shows Access denied.
Local GLB viewer
/canvas/glb shows a GLB model without uploading it. It opens when you drop a .glb file on the dashboard, and
the file stays in your browser. You can also point it at a URL:
/canvas/glb?url=<glb url>loads one model./canvas/glb?manifest=<json url>loads a set of frames from a manifest, with a frame picker.frame=<index>in the URL picks the frame. Frame URLs are relative to the manifest.
{
  "title": "Shear deformation",
  "initialFrame": 0,
  "frames": [
    { "url": "frame-0.glb", "label": "t = 0", "timestep": 0 },
    { "url": "frame-1.glb", "label": "t = 75000", "timestep": 75000 }
  ]
}
The local viewer has no pipeline panel and no timeline.
Narrow screens
Below 1200 px wide the pipeline panel becomes a drawer over the viewport, opened with Open canvas panel at the right edge. On phones it is a floating card under a round button, and the timeline tabs become a menu.
URL parameters
The canvas keeps part of its state in the URL, so a link reopens the same view:
| Parameter | Effect |
|---|---|
analysisId | The current analysis |
timestep | The frame to open on |
timelineExposure | The listing tab to open in the timeline |
grid=true | Shows the grid |
gizmo=false | Hides the axis gizmo |
statusBar=false | Hides the status bar |